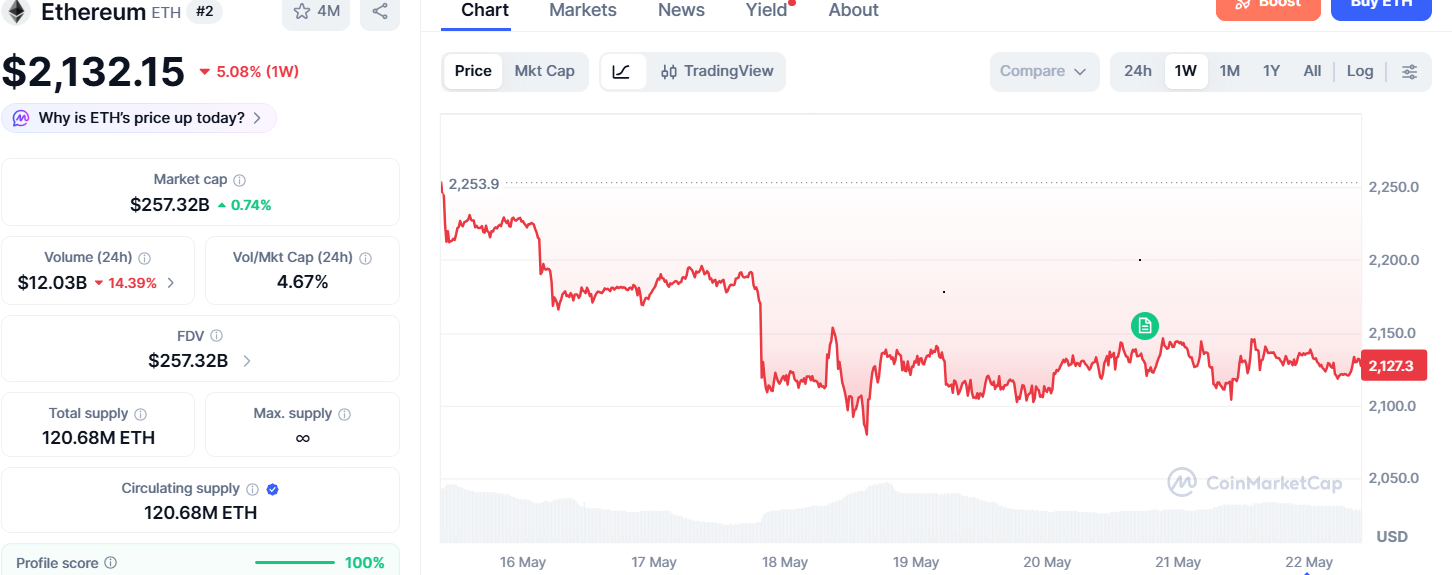
Ethereum trades at $2132.15 at the time of writing,posting over a 5.08% drop over the past seven days. Ethereum remains under pressure after falling below the key $2.2k support zone, with prices trading near $2,132 following a sharp weekly decline.
Weak momentum, declining volume, and continued selling pressure suggest the market is still struggling to establish a stable recovery trend.
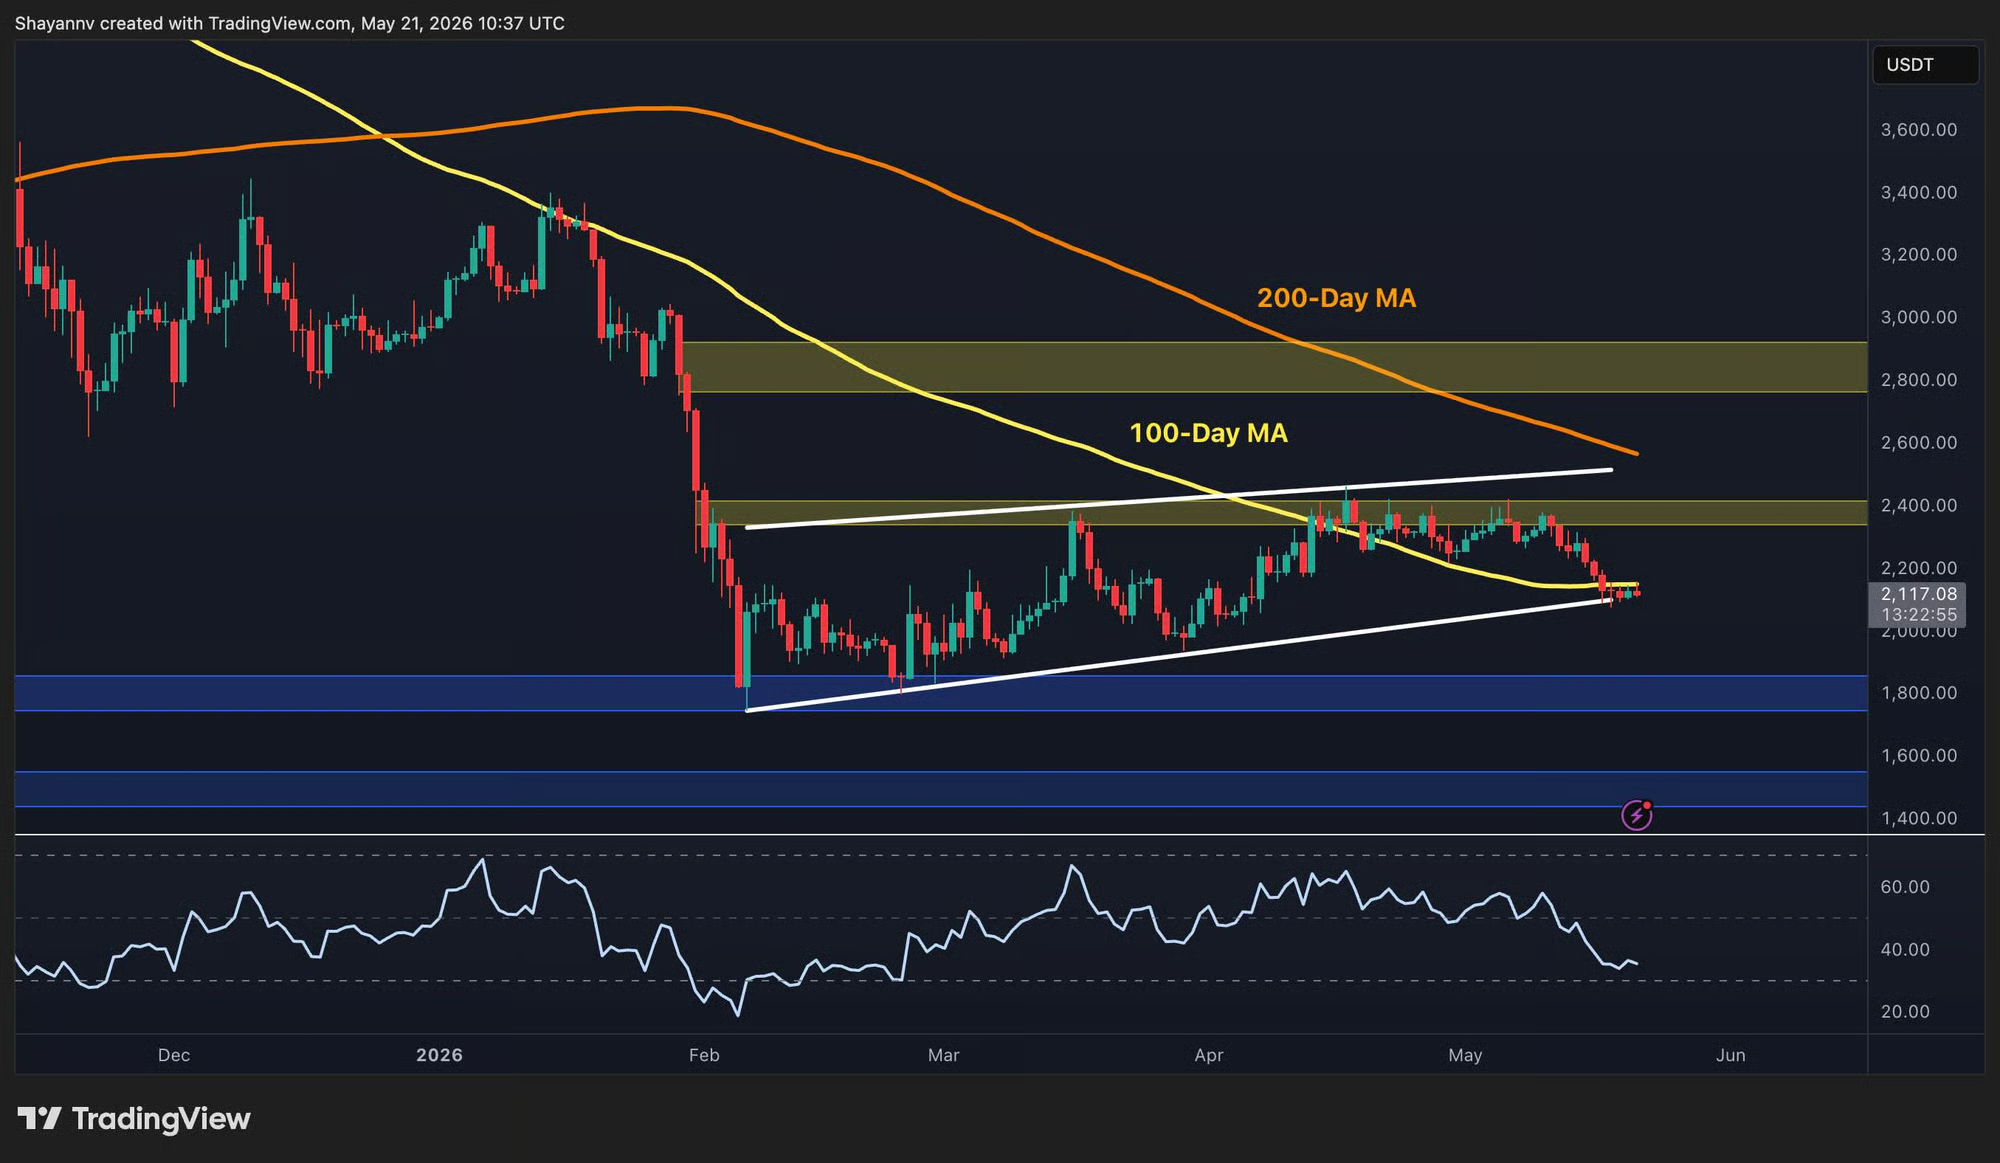
The recovery trend from February’s low is weakening as the asset breaks below the lower boundary of its ascending daily channel for the first time since the rebound began. The 100-day moving average near $2.2k has also been lost on a daily closing basis, signaling growing bearish pressure.
Momentum indicators continue to deteriorate, with the RSI falling below 40 its weakest level since February’s sharp sell-off while no clear bottom formation has emerged yet.
Attention is now shifting toward the $1.8k demand zone, which previously acted as the key support during February’s decline. On the upside, the former support around the $2.2k 100-day moving average has now turned into immediate resistance.
A sustained recovery above the $2.2k level is needed to indicate the current breakdown may be a temporary fakeout rather than the start of a deeper structural reversal.
Source:Cryptopotato
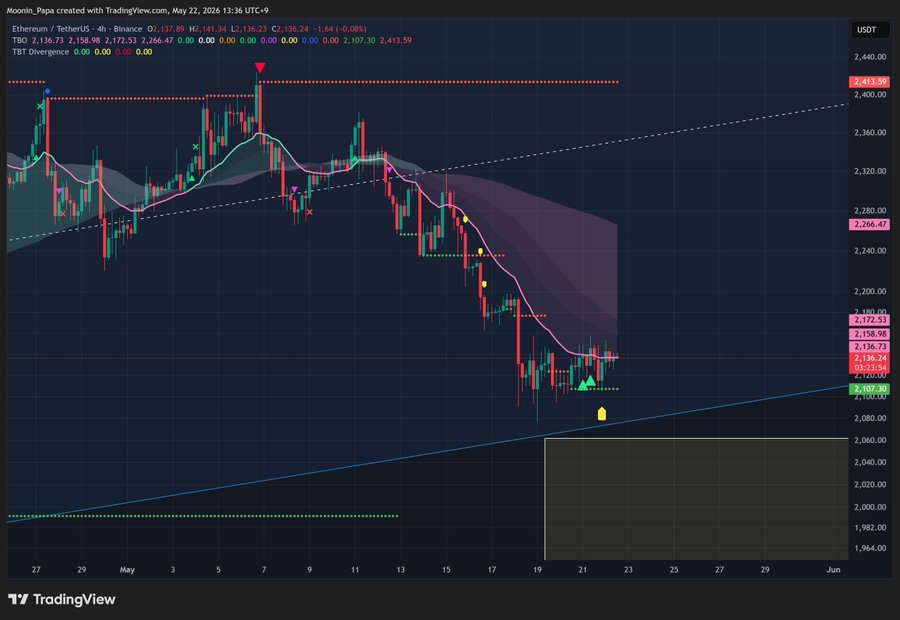
Ethereum remains trapped in a weak and fragile recovery despite short-term upward movement. Strong institutional selling pressure and ongoing fundamental weakness continue to weigh heavily on price action, keeping the broader market structure bearish.
Analysts still see the risk of a major decline toward the $1,000 level before a true bear market bottom forms. Although multiple bullish divergence signals have appeared on the 4-hour chart, they have so far failed to generate strong buying momentum or confirm a lasting reversal.
Source:X
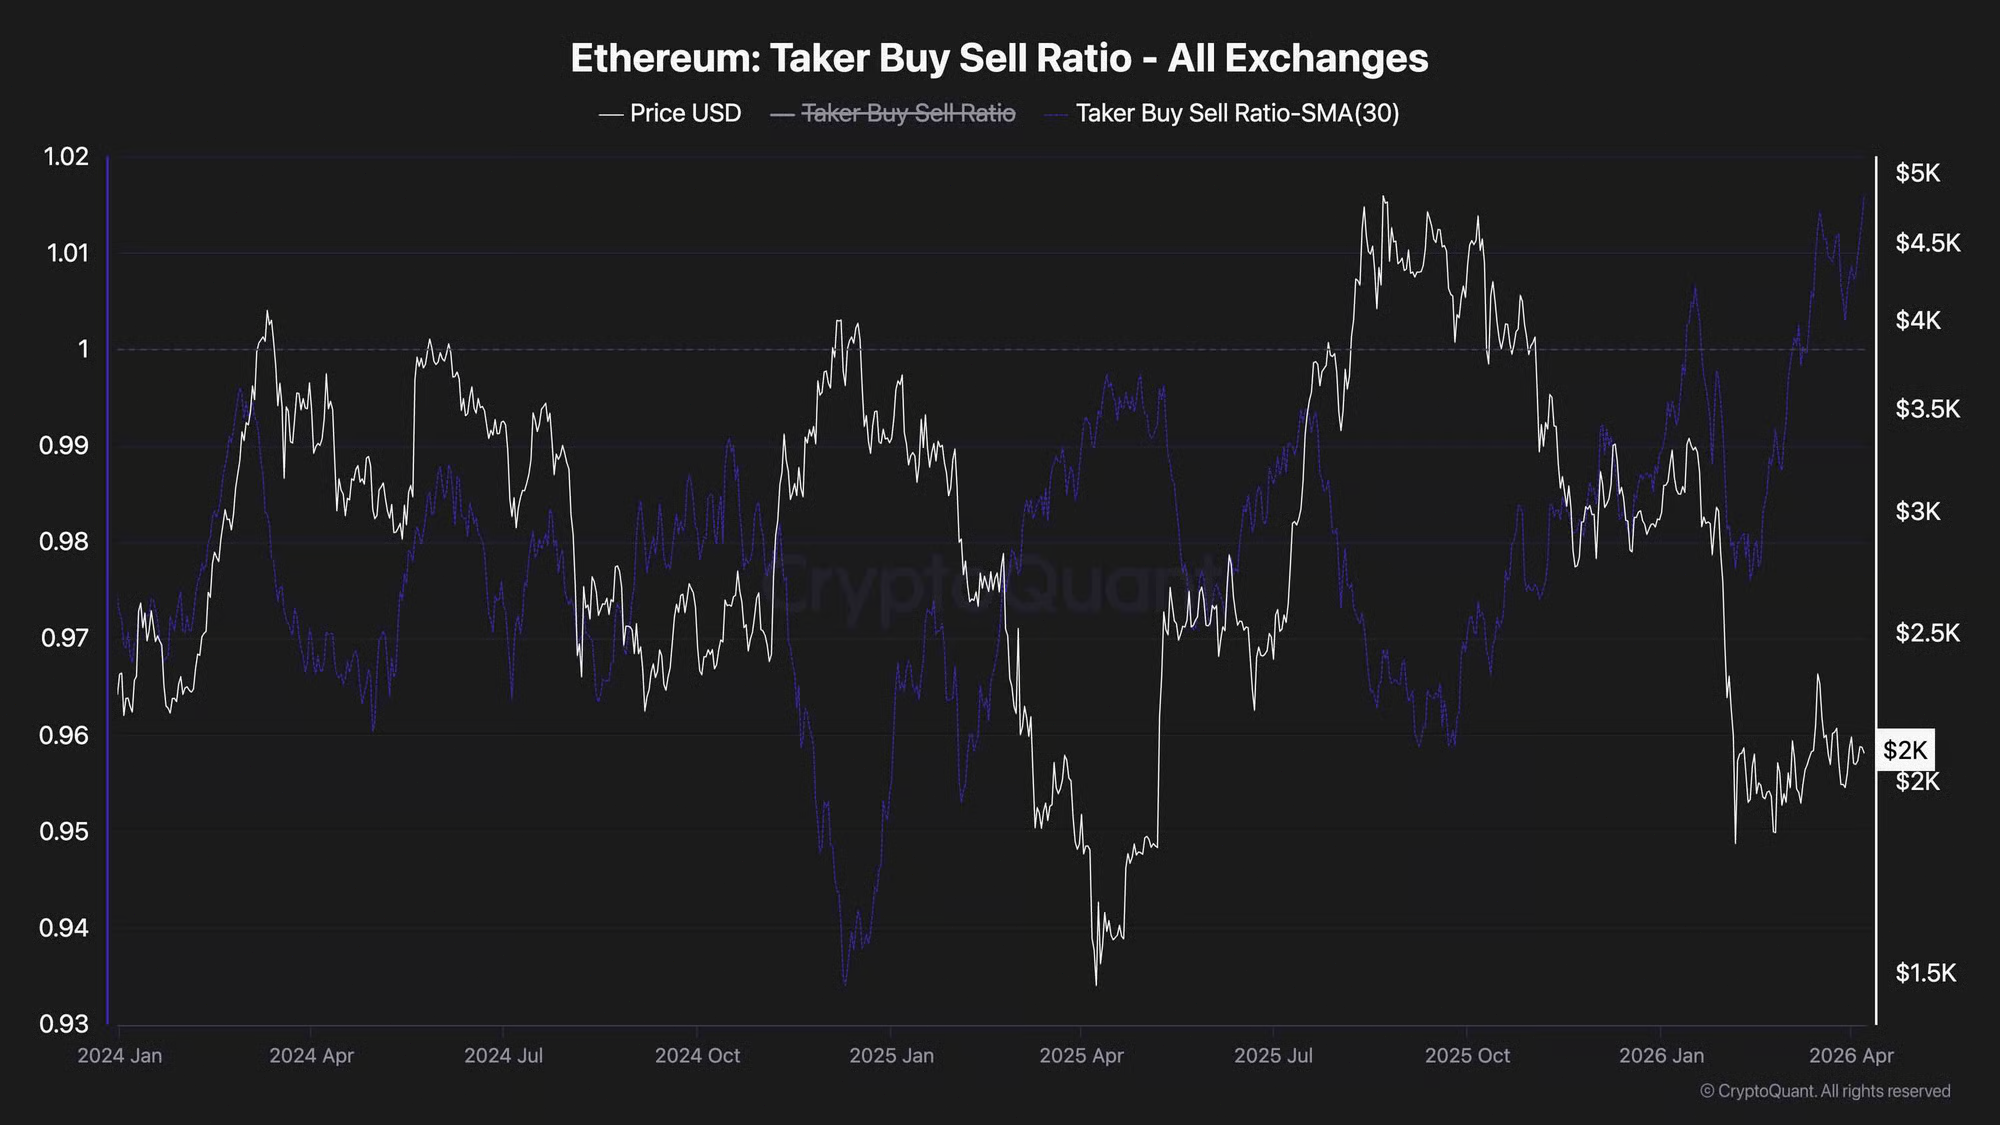
The Taker Buy/Sell Ratio continues to trend higher, maintaining steady readings above 1 throughout the past month, signaling increased activity from aggressive buyers in the market.
Despite this growing taker buy pressure, the market still remains within a broader bearish trend and sideways range. In previous market cycles, similar spikes have frequently emerged near short-term tops or temporary relief rallies instead of signaling the start of a lasting bullish reversal.
This indicates that the recent improvement in sentiment may be fueled more by speculative trading activity.If Ethereum fails to break above the critical $2.4k resistance level in the near term, the growing buildup of leveraged long positions could quickly unwind, triggering heightened downside volatility and potentially extending the broader bearish market structure.
Source:Cryptopotato
On-Chain Media articles are for educational purposes only. We strive to provide accurate and timely information. This information should not be construed as financial advice or an endorsement of any particular cryptocurrency, project, or service. The cryptocurrency market is highly volatile and unpredictable.Before making any investment decisions, you are strongly encouraged to conduct your own independent research and due diligence
Tags :

0 Comments
Show More

XRP faces mounting bearish pressure as whales sell millions of tokens and network activity declines.

Tether is integrating USDT wallet technology into Neura Robotics' autonomous robots, allowing them to receive crypto payments for completed tasks.

AI-related mentions in SEC filings and investor presentations surged to a record 46,000 in Q1 2026, according to
On-Chain Media is an independent, reader-funded crypto media platform. Kindly consider supporting us with a donation.
bc1qp0a8vw82cs508agere759ant6xqhcfgcjpyghk
0x18d7C63AAD2679CFb0cfE1d104B7f6Ed00A3A050
CBaXXVX7bdAouqg3PciE4HjUXAhsrnFBHQ2dLcNz5hrM
Contains the last 12 releases