
Key Insights:
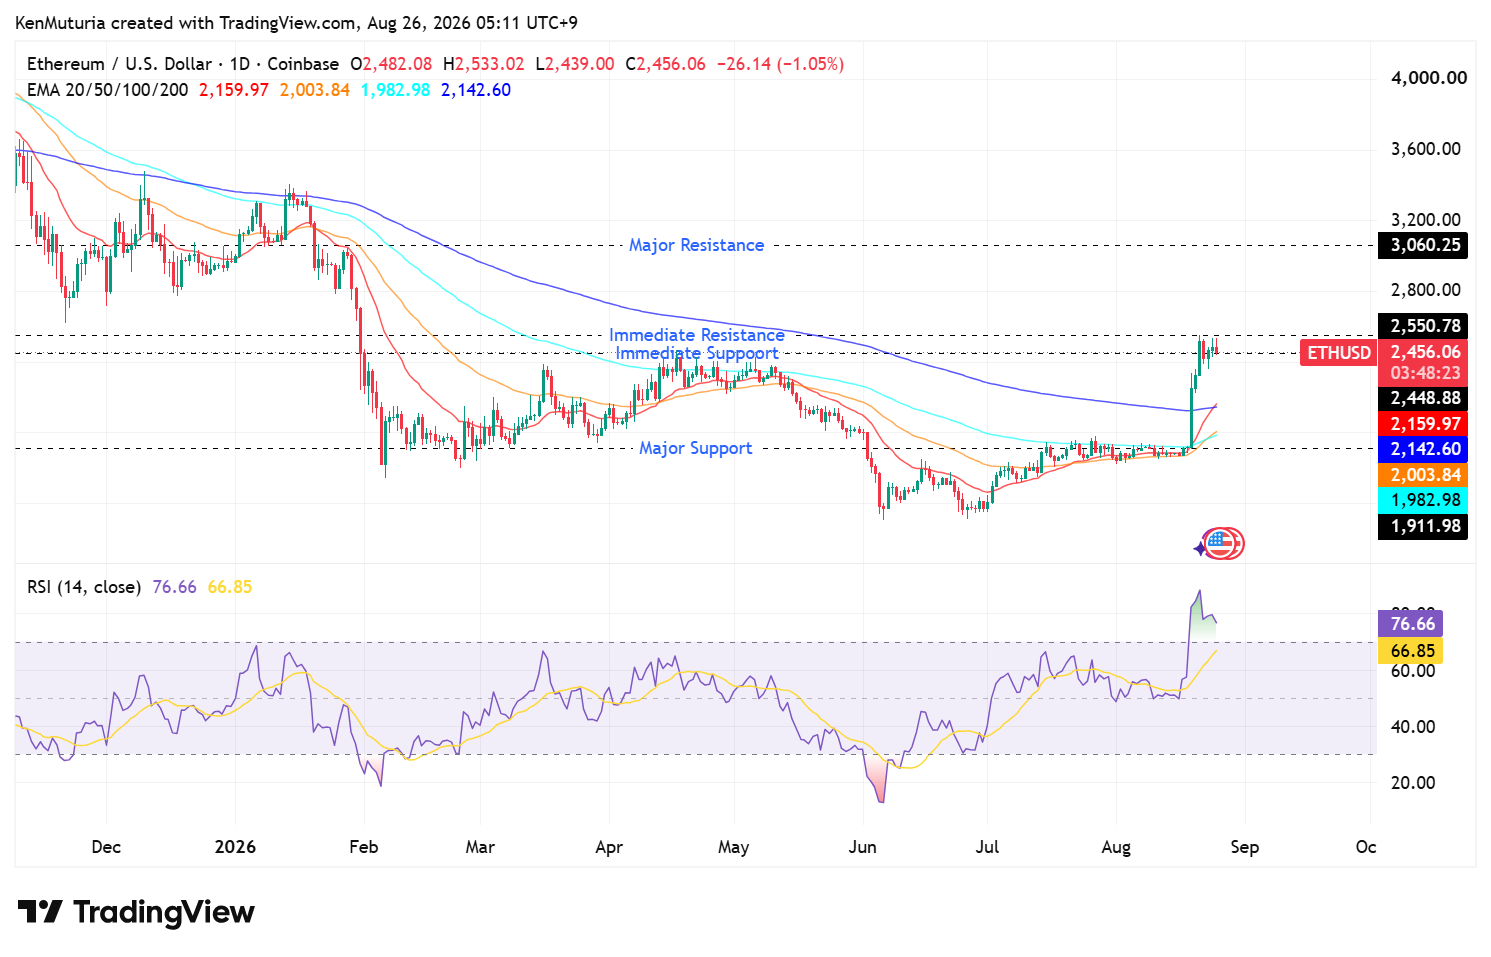
$ETH is trading around $2,470 after reaching $2,533.02, with the daily RSI at 78.26 and price still above the 20/50/100/200 EMAs.
The EMA structure remains constructive: 20-day EMA at $2,161.37, 200-day at $2,142.75, 50-day at $2,004.41 and 100-day at $1,983.27, keeping the broader trend bullish while defining the next support zones.
A daily close above $2,533 would strengthen the continuation setup toward $2,700, while $3,000 remains the major upside target highlighted by the fakeout-fractal thesis.
Ethereum’s breakout has outlasted the traders who expected it to fade. After escaping the $1,850–$1,950 range, ETH remains firmly above $2,400, with buyers now pressing against the August high at $2,533.
The latest daily chart shows ETH at $2,454.72, after an intraday high of $2,533.02 and low of $2,439.00. The move keeps the bullish structure intact, but the next test is clear: can Ethereum turn the $2,533 peak into a launchpad without first cooling off?
Why the Rally Is Holding
The breakout still has two important pillars: momentum and positioning. Ethereum is trading well above the major daily EMAs, while the recent upside move has kept buyers in control.
The chart also shows ETH holding above the previous breakout area around $2,340, which is now a broader support reference rather than the main line of defence.
The moving averages provide a stronger read of the trend. The 20-day EMA stands at $2,161.37 and is the closest major dynamic support. Above the 20-day sits the 200-day EMA at $2,142.75, followed by the 50-day EMA at $2,004.41 and the 100-day EMA at $1,983.27. Price remains above all four, confirming that the daily trend is bullish.
The EMA structure is especially important because the 50-day EMA is now above the 100-day EMA, reinforcing the improvement in medium-term momentum. The 20-day EMA is also rising sharply, showing that short-term demand has accelerated.
The 200-day EMA remains below price but above the 50- and 100-day averages, meaning Ethereum has reclaimed a long-term trend benchmark while the shorter averages continue to rebuild. For bulls, that combination favours buying dips rather than treating every pullback as a reversal.
Macro and flow narratives continue to support the move, although technical conditions are now becoming more important. The next phase will depend on whether new buyers can absorb profit-taking around the recent high.
Expert Analysis
Analyst @MerlijnTrader’s fakeout-fractal view remains relevant. His comparison with the June 2025 structure argues that Ethereum could avoid the deep retest many traders are waiting for. In that framework, a controlled pullback toward the $2,200–$2,300 region would still fit the bullish structure before another leg higher.
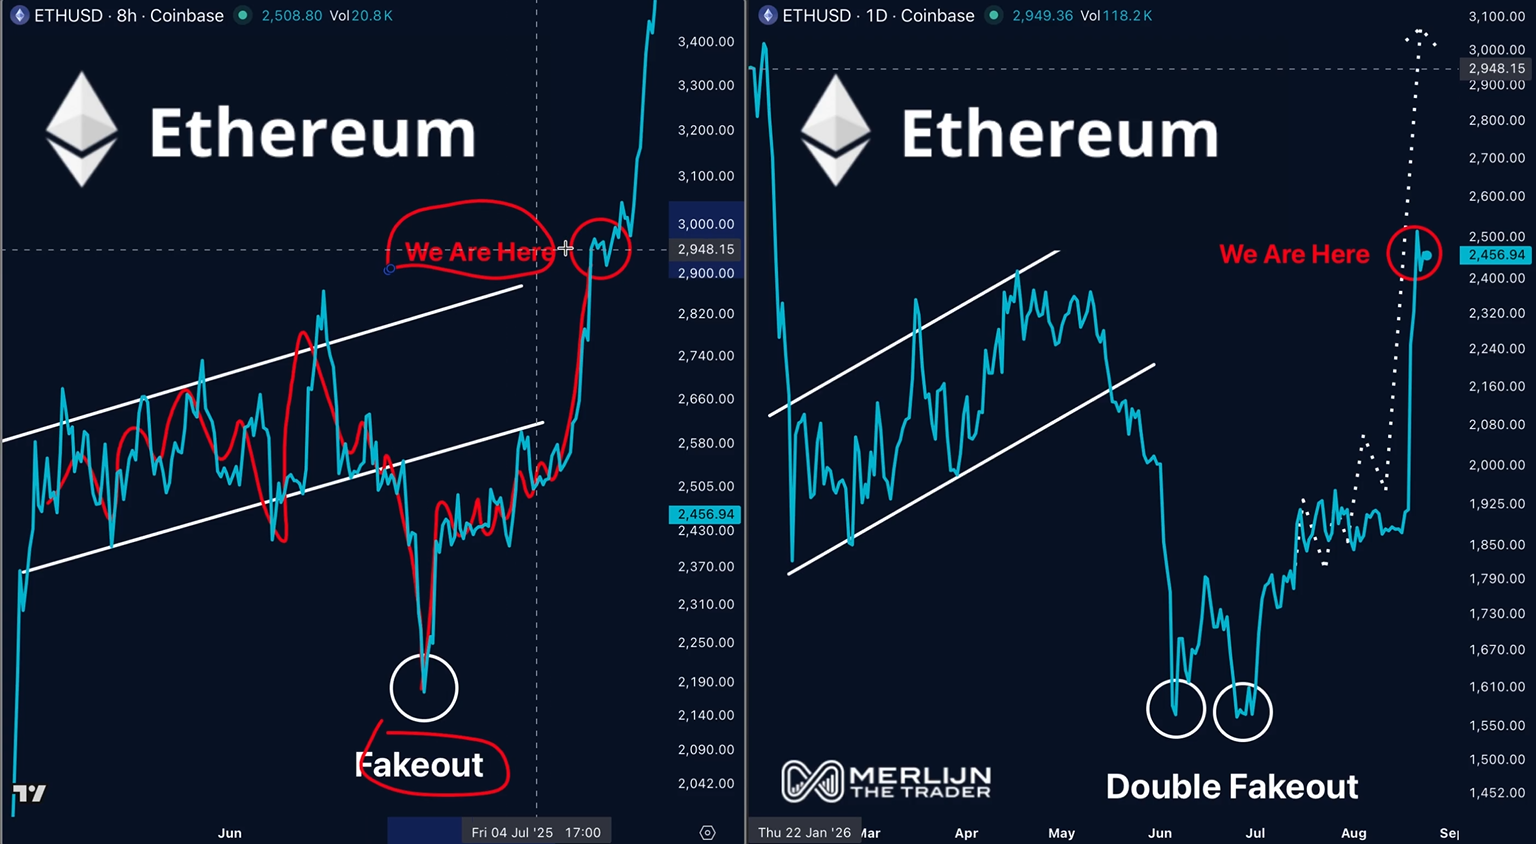
Crypto analyst @cryptocupra sees a larger version of the same fakeout structure now unfolding. His post argues that Ethereum has repeated the pattern of a fakeout followed by a reclaim and a strong launch, saying the setup could erase the $5,000 level and accelerate a move toward $10,000.
That view is considerably more bullish than the near-term chart alone, so the $2,533 breakout still matters as the immediate confirmation level before those much higher targets become technically relevant.
The two views focus on different mechanics, but both keep the emphasis on continuation rather than a return to the old range. The risk is timing: a bullish structure can remain intact while price still experiences a sharp short-term correction.
The Chart: Fresh Breakout, Overbought Momentum
The daily chart shows why the breakout deserves attention. ETH pushed through the prior resistance zone and has continued higher, but momentum is now stretched. The 14-day RSI stands at 76.66, while its moving average is at 66.85.
RSI above 70 signals overbought conditions, and the wide gap between RSI and its moving average shows that short-term momentum is running well ahead of its smoothed trend. This builds on our previous analysis, Ethereum’s Second Wind, but the current chart now shifts attention to higher resistance and a wider set of dynamic supports.
This does not automatically mean a reversal. Strong trends can stay overbought for longer than traders expect. However, the elevated RSI increases the probability of consolidation or a shallow pullback before Ethereum makes a sustained attempt at new highs.
Levels to Watch
Resistance: $2,533.02 is the key near-term ceiling and the latest daily high. A decisive close above it would put $2,700 in focus, with $3,000 as the major psychological and structural upside target.
First support: $2,439–$2,450 is the immediate short-term support zone, based on the latest daily low and the area where buyers are currently defending the breakout.
Dynamic support: the 20-day EMA at $2,161.37 and 200-day EMA at $2,142.75 form an important support cluster. A deeper correction would bring the 50-day EMA at $2,004.41 and 100-day EMA at $1,983.27 into focus, followed by the former $1,912 breakout-support floor.
For now, ETH remains bullish while price holds above the EMA structure and the reclaimed breakout zone. The key question is no longer whether Ethereum has broken out, but whether buyers can clear $2,533 without giving the market a larger reset first.
On-Chain Media articles are for educational purposes only. We strive to provide accurate and timely information. This information should not be construed as financial advice or an endorsement of any particular cryptocurrency, project, or service. The cryptocurrency market is highly volatile and unpredictable.Before making any investment decisions, you are strongly encouraged to conduct your own independent research and due diligence
Tags :

0 Comments
Show More

Nvidia falls as AI-safety concerns, DOJ scrutiny of its $17 billion Groq licensing deal and profit-taking pressure weigh on shares.

Bitcoin faces rising Fed rate-hike odds, a hawkish ECB, and a make-or-break Senate cloture vote on the CLARITY Act — all landing in the same five-day window.

Circle's largest deal since Poloniex brings a licensed cross-border payments network in-house.
On-Chain Media is an independent, reader-funded crypto media platform. Kindly consider supporting us with a donation.
bc1qp0a8vw82cs508agere759ant6xqhcfgcjpyghk
0x18d7C63AAD2679CFb0cfE1d104B7f6Ed00A3A050
CBaXXVX7bdAouqg3PciE4HjUXAhsrnFBHQ2dLcNz5hrM
Contains the last 12 releases