Key Insights:
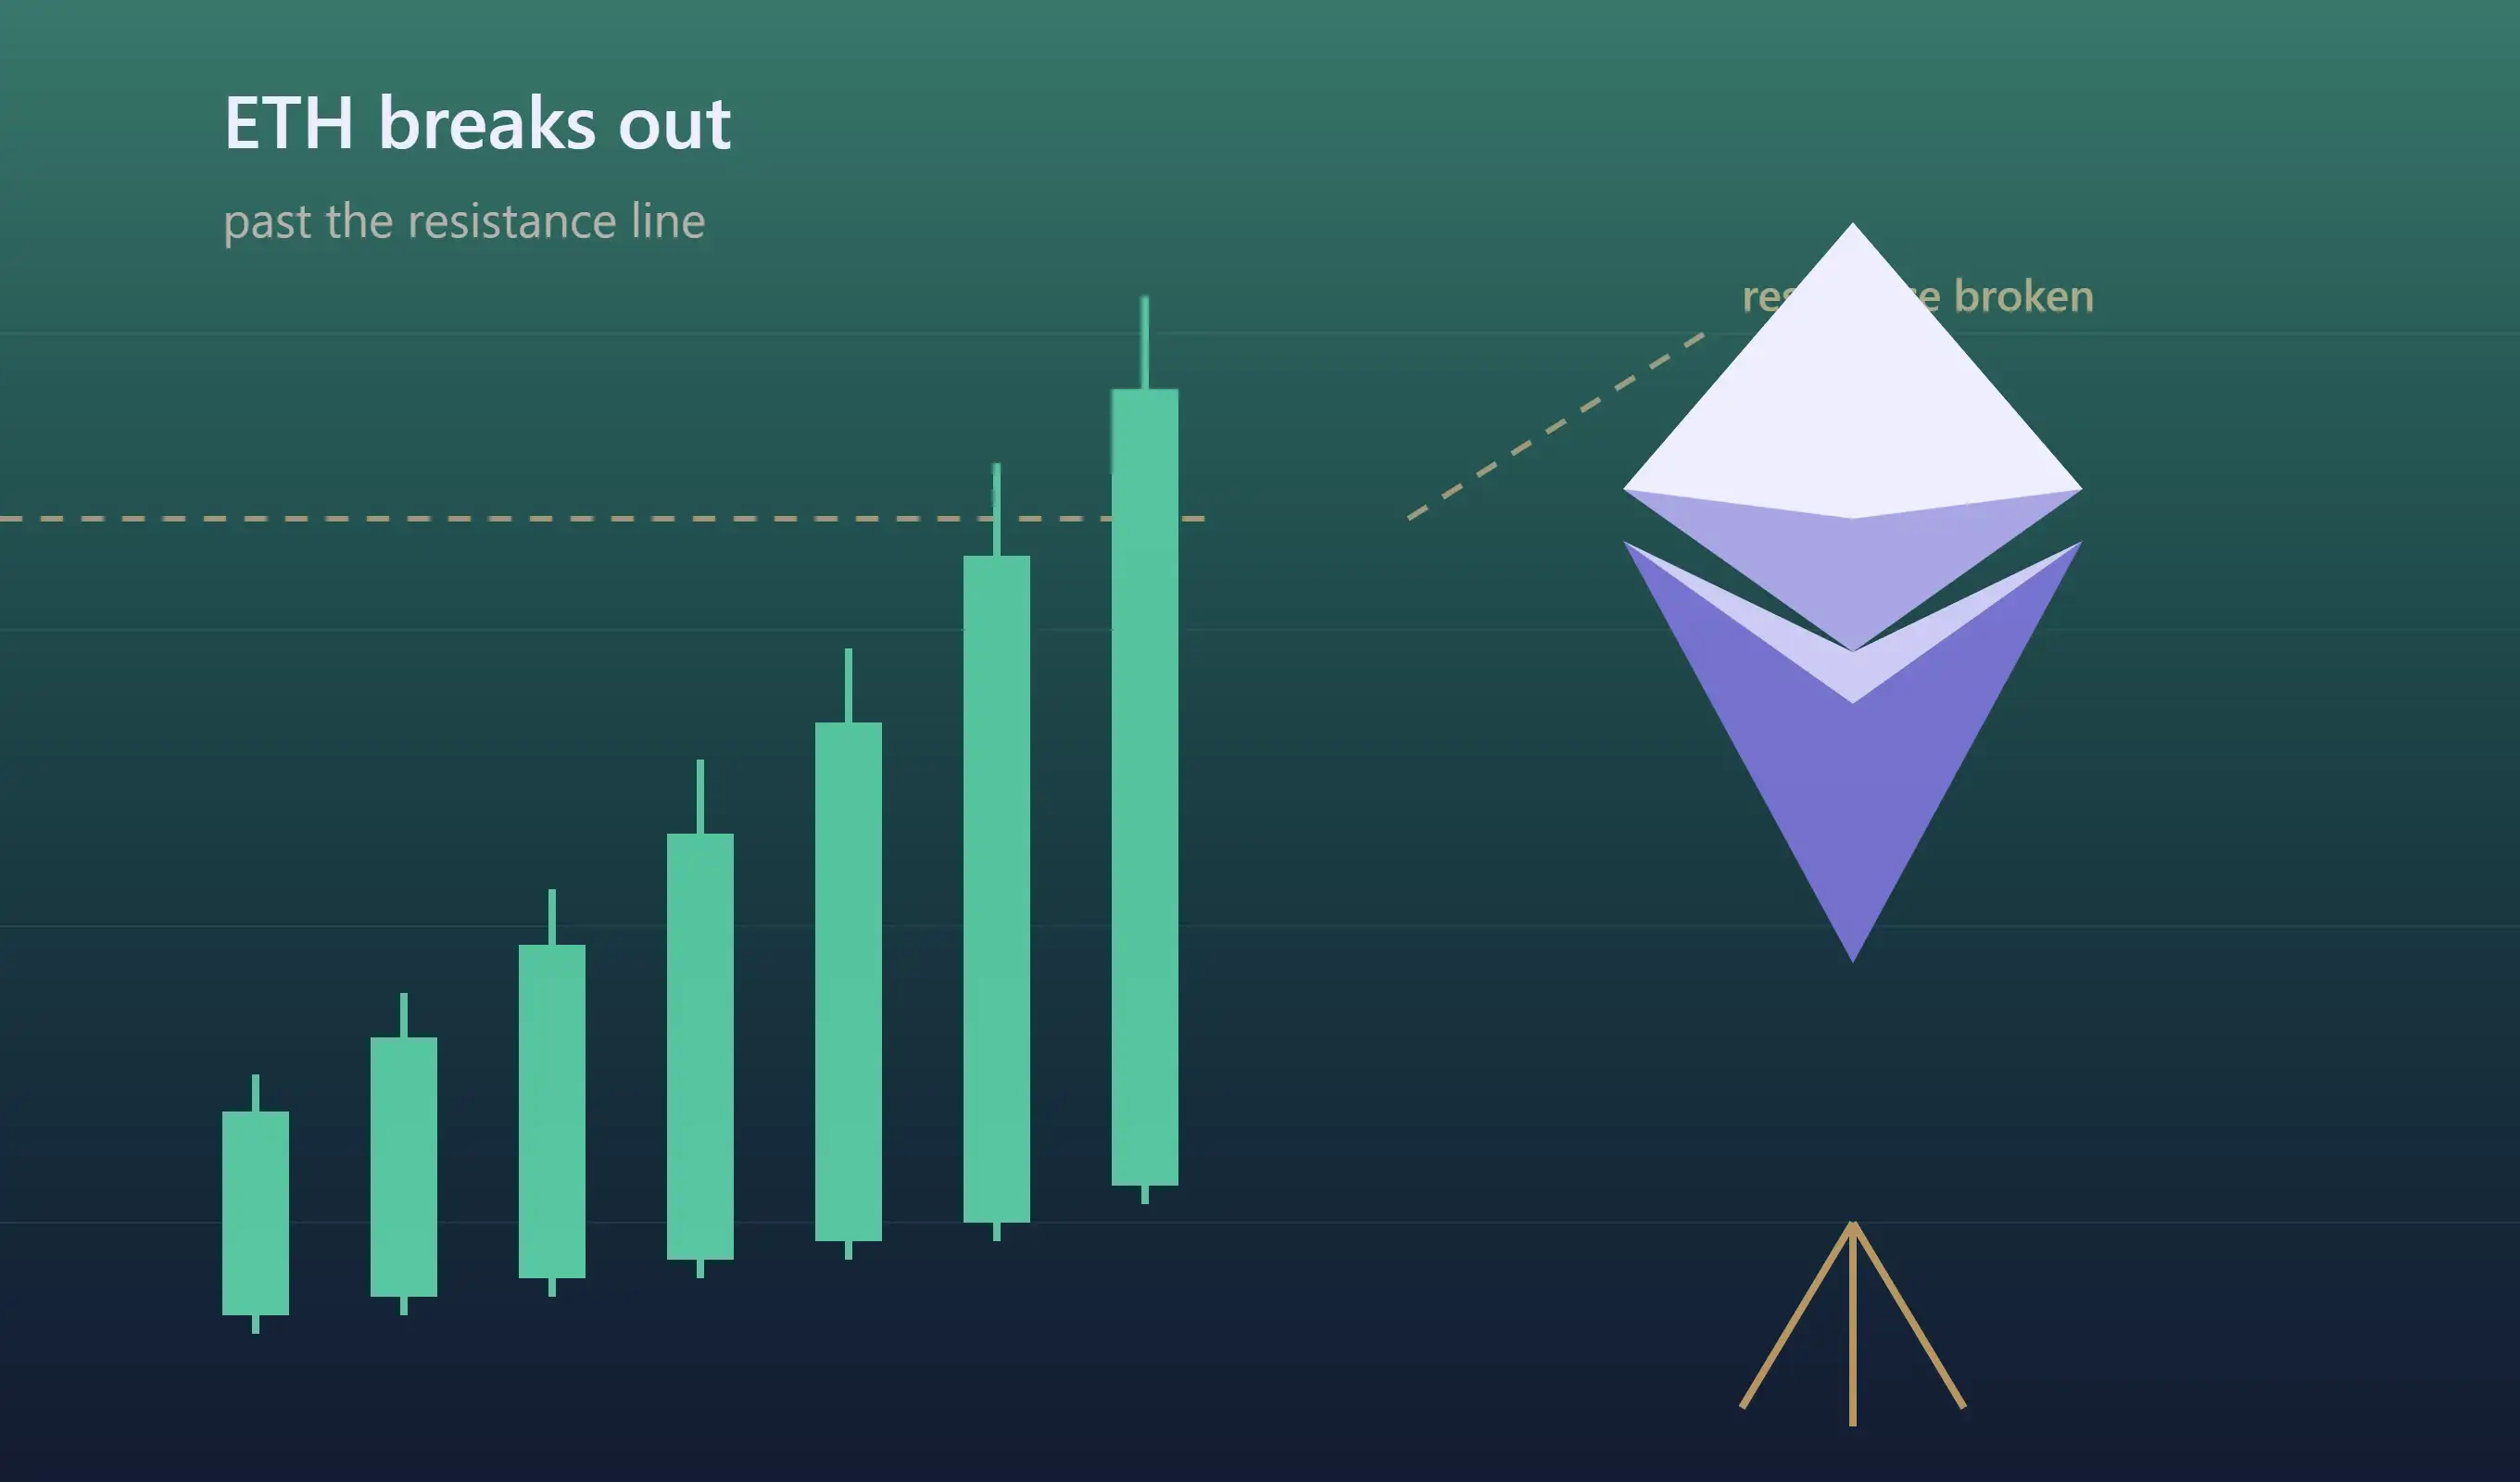
$ETH surged roughly 20% in 24 hours, breaking a multi-week 1,850–1,950 range and trading near $2,330 as of Thursday 20,and the biggest ETF inflow day in ten months.
Every key moving average, now sits well beneath spot price, but daily RSI above 84 signals an overbought market that could pause before its next leg.
Trader BladeDefi says $ETH is retracing its 2025 bottom-sweep-consolidation-rally fractal and may be entering the consolidation phase right now, a structure that mirrors Ethereum's April-to-August 2025 run from $1,385 to a $4,946 all-time high.
Ethereum just did something it hasn't managed in months. The break-out is hard and traders are still arguing over whether to chase it or wait for a pullback.
Over the past two trading days, $ETH tore through a stubbon $1,850–$1,950 consolidation range and printed highs above $2,350. That's a gain of roughly 20% in barely 24 hours. As of 20th August 2026, $ETH trades at $2,331.86 on CoinGecko.
Daily trading volume hit $25.286B billion, and Ethereum's market cap now sits near $280 billion. That's still 52.7% below the $4,946.05 all-time high from August 2025. So is this a real recovery or a short-term squeeze wearing a bull costume?
Why $ETH Suddenly Surged
Three forces collided at once. Leveraged short sellers absorbed the first blow: the market wiped out more than $1.4 billion in short positions on August 19 alone, with Ethereum's own liquidation total reportedly closer to $2.9 billion. Rising prices forced shorts to cover, and covering pushed prices higher still.
Real capital showed up next. Spot $ETH ETFs pulled in $189.15 million on August 19 alone, their biggest single-day haul since October 2025. August inflows now total $534.2 million, the strongest month of the year for these funds.
Macro and politics lined up too. The US Treasury doubled its long-end bond buybacks to $4 billion per operation, pushing yields lower and weakening the dollar. President Trump also pushed Congress on the Clarity Act, the bill that would settle whether crypto counts as a security or a commodity. Bitmine chairman Tom Lee kept framing Ethereum as AI's verification layer, tying the rally to a bigger story than short covering.
Expert Analysis
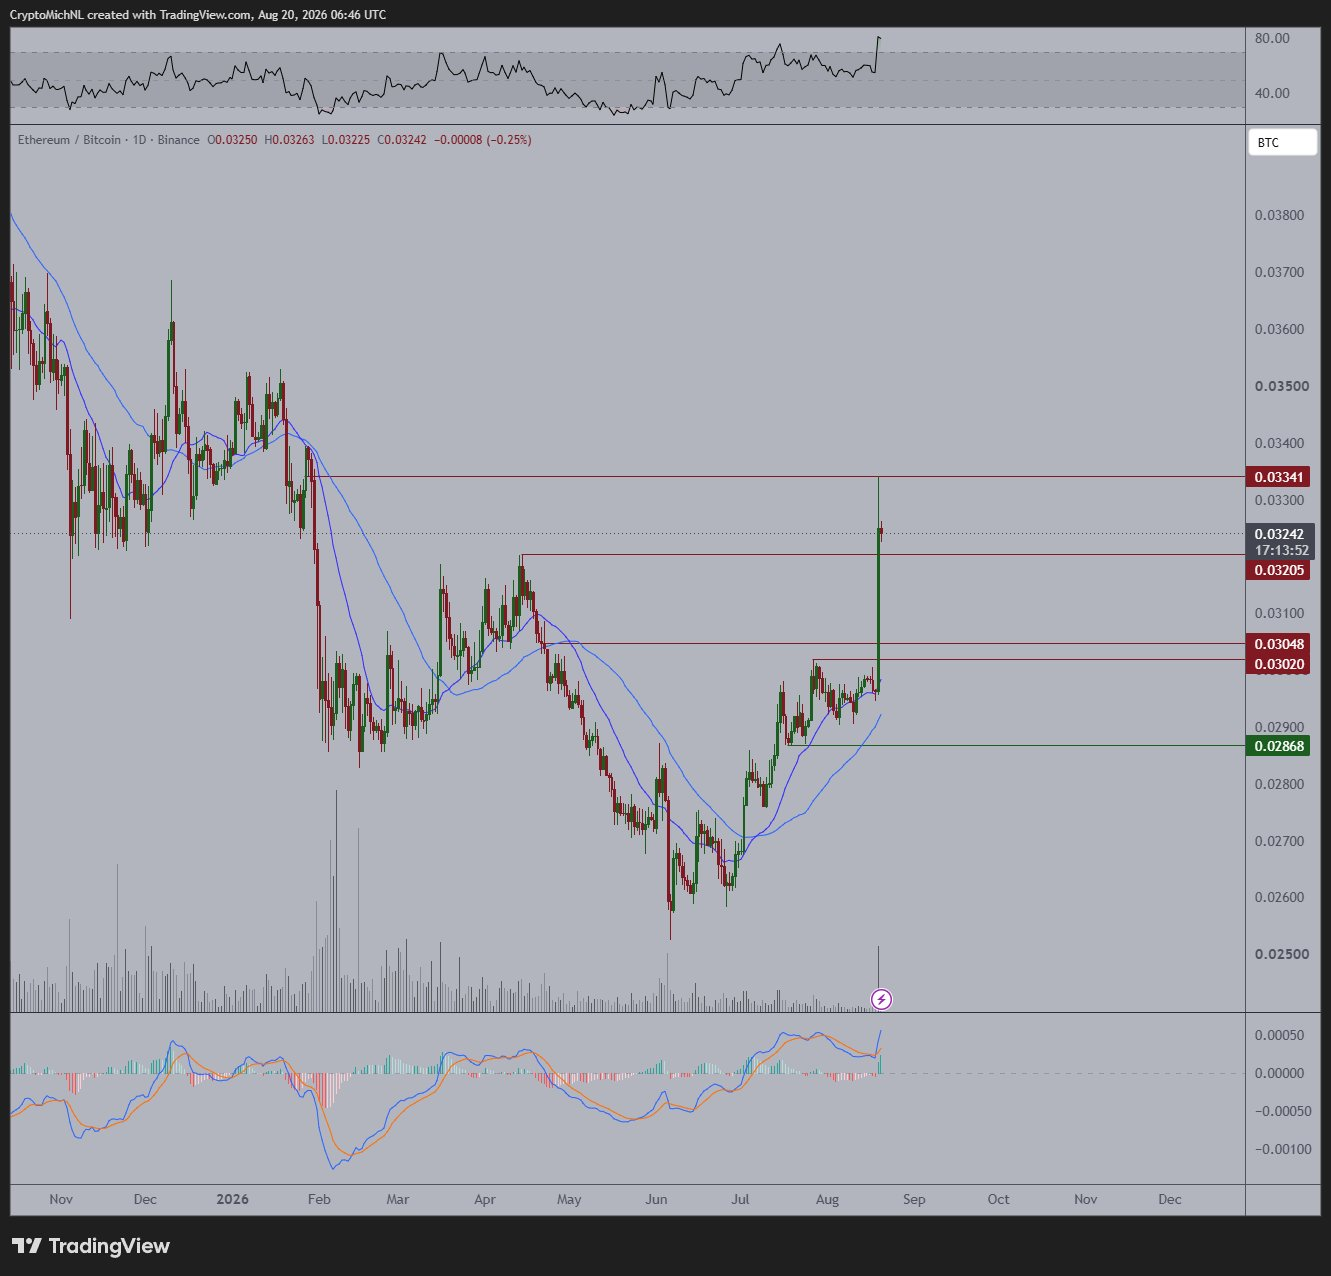
Crypto analyst @CryptoMichNL called the move "an absolutely amazing" run on August 20, noting $ETH swept toward 0.033 against Bitcoin and adding that he'd treat any retrace as a buying opportunity rather than a warning sign.
Trader @BladeDefi flagged that $ETH's chart is repeating its 2025 structure almost exactly; bottom→sweep the range highs→consolidate→rally and he believes the market is stepping into that consolidation phase right now.
The comparison holds up well. $ETH bottomed near $1,385 in April 2025 after Trump's tariff shock, based for weeks, then rallied from roughly $1,800 to a new all-time high of $4,946 by August 24, as the GENIUS Act, record ETF inflows, and corporate treasury buying powered the climb.
This cycle's low landed earlier in 2026, somewhere between $1,580 and $1,743, before $ETH ground sideways for months and swept to $2,350 this week. If the fractal holds, a cooling-off period comes next, not a straight shot to new highs.
The Chart: Overbought but Structurally Different
$ETH's chart changed shape fast, and it's stronger than the headline number suggests. The 20-day EMA sits near $1,997, the 50-day near $1,919, and the 100-day near $1,940; all now below spot. The 200-day EMA, often left out of quick takes, sits near $2,126, a level price only just reclaimed and worth watching as the next line of defense on any pullback. Resistance that buyers reclaim this convincingly tends to flip into support.
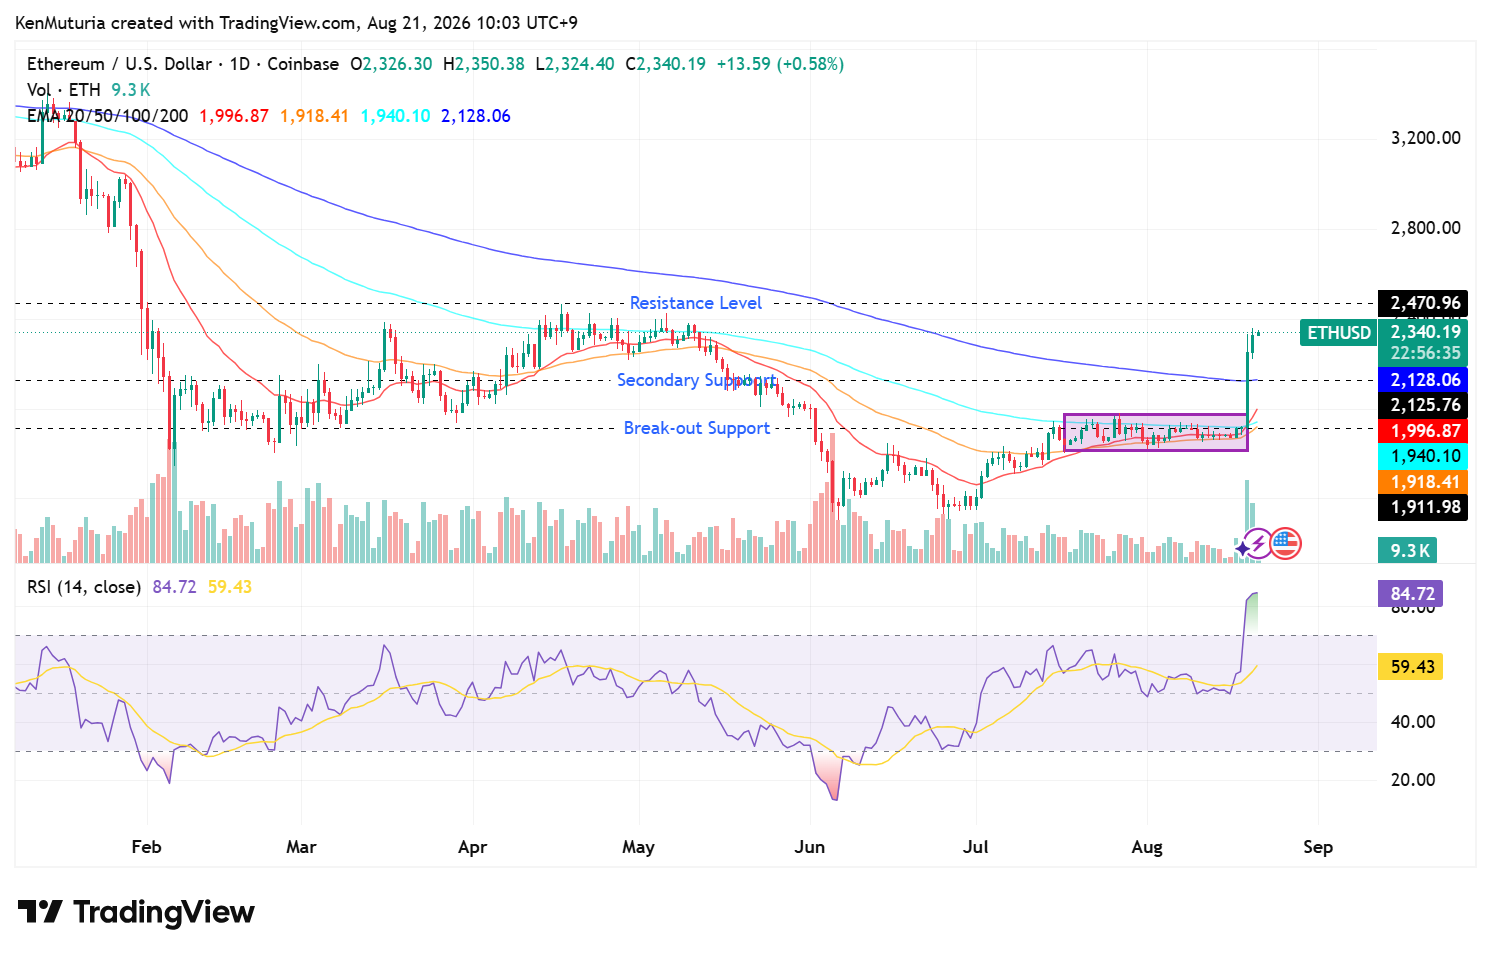
Momentum has caught up to the price. Daily RSI has climbed to roughly 85, comfortably past the 70 line that marks overbought, a level it hadn't reached on the initial breakout candle, when RSI was still closer to neutral, but has since reached as the rally extended into a second leg.
That's a genuine overbought signal now, typically inviting at least a pause. Liquidation-cluster claims still come from options and futures data, not the price chart, so they're worth treating separately from what the chart confirms.
Key Levels to Watch
Immediate support zone $1890-$1950, which is reinforced by the 20-day and 100-day EMA’s.
$2,126 becomes the next support to defend as confirmed by the 200-day EMA.
Hold above $2,300, and the $2,420–$2,450 zone, which most trackers now flag as a resistance-level comes into view. A daily close above the resistance would be the clearest signal yet that this is a real trend change, not just shorts finding the exit.
On-Chain Media articles are for educational purposes only. We strive to provide accurate and timely information. This information should not be construed as financial advice or an endorsement of any particular cryptocurrency, project, or service. The cryptocurrency market is highly volatile and unpredictable.Before making any investment decisions, you are strongly encouraged to conduct your own independent research and due diligence
Tags :

0 Comments
Show More
Nvidia falls as AI-safety concerns, DOJ scrutiny of its $17 billion Groq licensing deal and profit-taking pressure weigh on shares.

Bitcoin faces rising Fed rate-hike odds, a hawkish ECB, and a make-or-break Senate cloture vote on the CLARITY Act — all landing in the same five-day window.

Circle's largest deal since Poloniex brings a licensed cross-border payments network in-house.
On-Chain Media is an independent, reader-funded crypto media platform. Kindly consider supporting us with a donation.
bc1qp0a8vw82cs508agere759ant6xqhcfgcjpyghk
0x18d7C63AAD2679CFb0cfE1d104B7f6Ed00A3A050
CBaXXVX7bdAouqg3PciE4HjUXAhsrnFBHQ2dLcNz5hrM
Contains the last 12 releases