
Key Insights
Bitcoin compresses near major resistance as volatility fades.
Futures data and liquidity hint at a sharp move ahead
Analysts split on a $100K breakout versus short-term correction.
As of January 13, 2026, Bitcoin (BTC) is trading around $94,200, reflecting an ongoing consolidation near key resistance zones while volatility remains subdued. Traders know this pattern and it never lasts long.
It is not the first time that BTC has behaved in this manner; the recent squeeze of between $87K and 95K created the pressure before the volatility came back. The existing arrangement resembles only a higher position on the chart as stakes rise with price.
Sentiment is dominated by the psychological level of $100,000 which is a technical barrier and psychological attractiveness. Breaking it means momentum traders can run in while rejecting it breaks confidence.
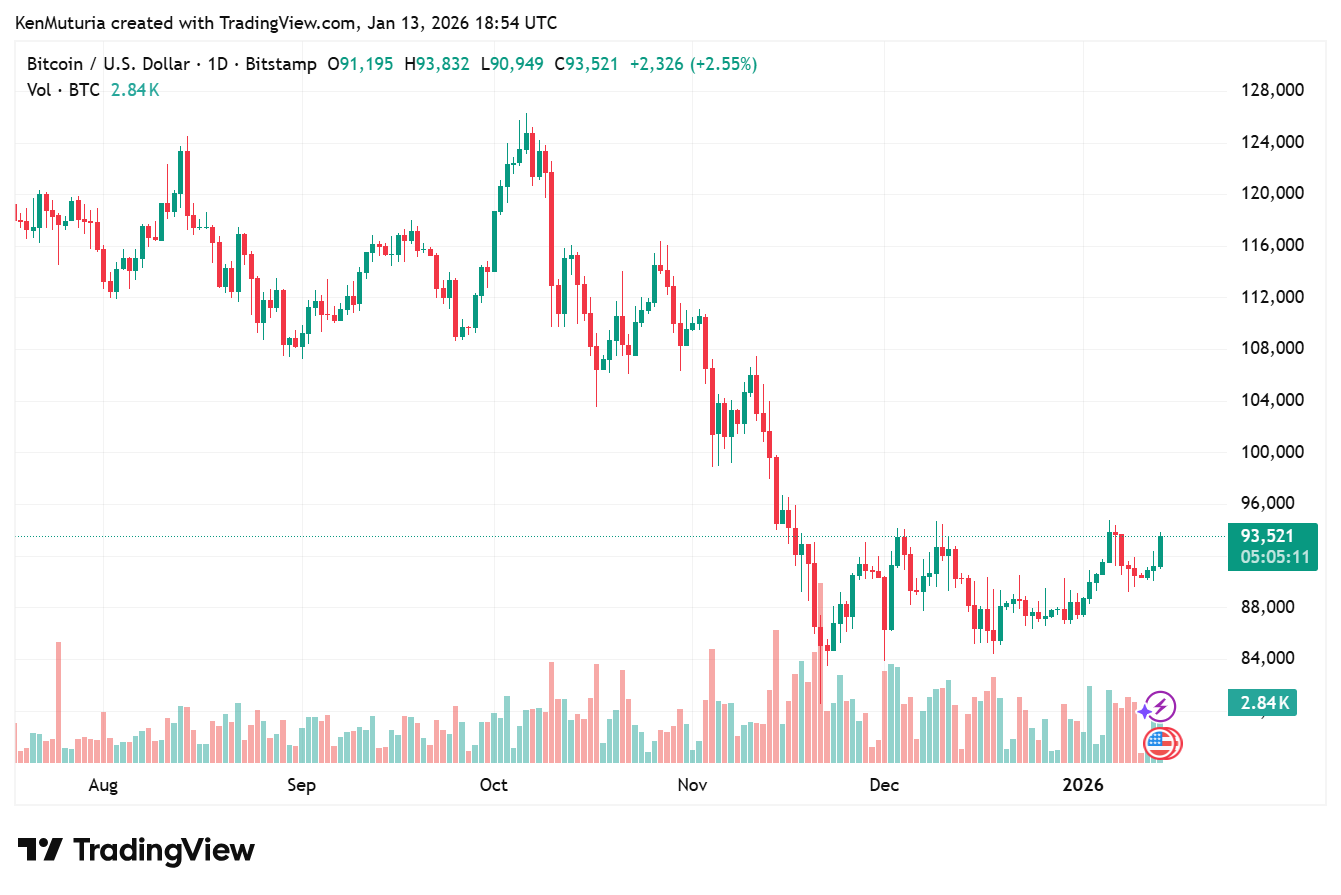
Source: TradingView
Bitcoin is trading within a narrow range with the support holding firm in the low 90k and resistance capping upside near 94k.
Momentum indicators such as RSI show neutral readings while, while trading volume remains moderate reflecting indecision. The combination of the two is usually followed by growth as patience does not always succeed in markets.
Lateral prices disappoint traders and if BTC breaks from the equilibrium, the move tends to be swift and strong.
Futures and Liquidity Shape the Battlefield
Lateral prices disappoint traders and if BTC breaks from the equilibrium, the move tends to be swift and strong.
The derivatives show that whales are acting cautiously, and big holders are shedding aggressive positions. Clusters of liquidity above resistance and below support form possible triggers: a breakout may give rise to short liquidations and accelerate gains, whereas failure may precipitate long liquidations and increase corrections.
The trend reflects the historical times of consolidation, implying that the market is setting the stage of major directional determination. That behavior matters as strong directional moves were preceded by the reduction of whale risk in the past.
Price only needs a spark.
Weekly Structure And Analyst Views
In a recent X post, crypto analyst Rekt Capital takes a disciplined stance as he focuses on the weekly chart. His analysis shows Bitcoin consolidating below a major resistance zone that rejected the price before.
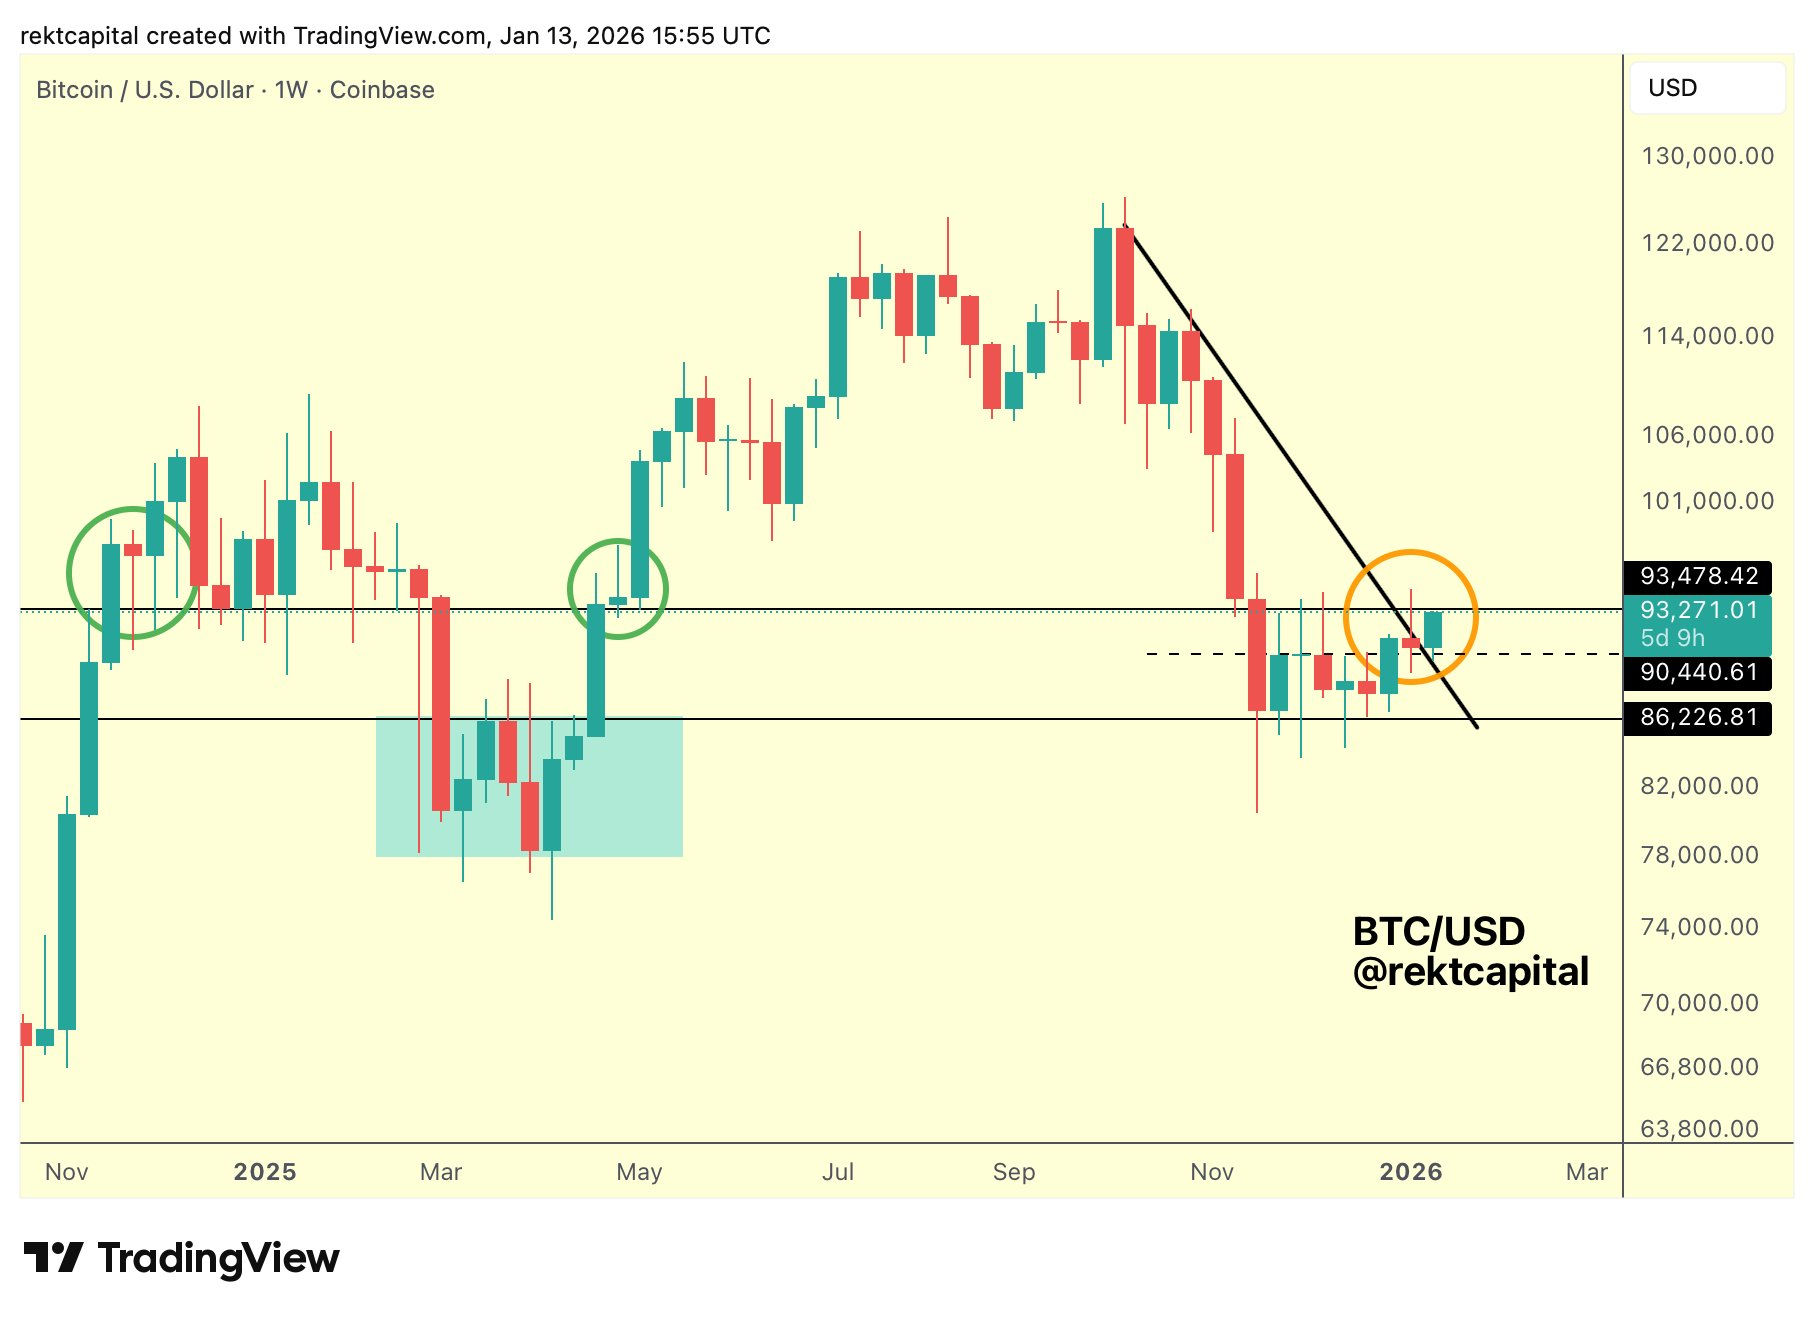
He also warns against chasing intraday moves. A clean weekly close above resistance would confirm a breakout toward $100K and beyond, whereas pullbacks within the range do not necessarily undermine the broader uptrend.
Bulls, Bears, and the Same Chart
Bulls cite historical patterns, compression, and liquidity imbalances as catalysts for upward moves, while bears highlight fading momentum and crowded positioning near round numbers, reflecting the uncertainty at this critical level.
Bitcoin thrives on moments like this as indecision breeds opportunity while direction resolves doubt.
What Breaks the Stalemate?
Ultimately, volume and catalyst events determine direction. Breakouts with low participation often fail, whereas heavy volume signals genuine momentum. Macro factors such as liquidity and risk-on sentiment add influence, but current dynamics are dominated by internal market forces.
Bitcoin sits at a crossroads and an aggressively confirmed move above resistance would trigger a run at the 100K. Failure may bring a sharp correction that resets leverage and rebuilds momentum.
Either way, silence will not last and the next move will speak loudly.
On-Chain Media articles are for educational purposes only. We strive to provide accurate and timely information. This information should not be construed as financial advice or an endorsement of any particular cryptocurrency, project, or service. The cryptocurrency market is highly volatile and unpredictable.Before making any investment decisions, you are strongly encouraged to conduct your own independent research and due diligence
Tags :

0 Comments
Show More
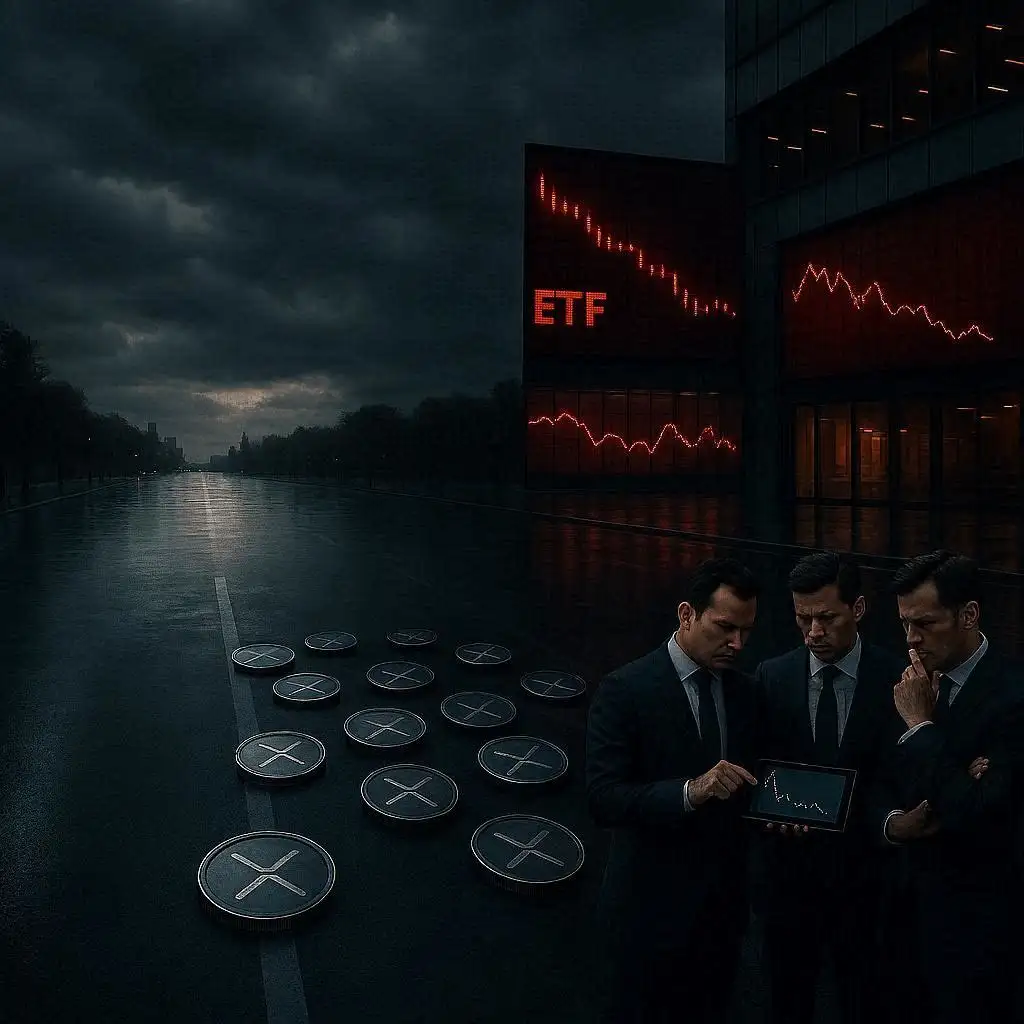
XRP faces mounting bearish pressure as whales sell millions of tokens and network activity declines.
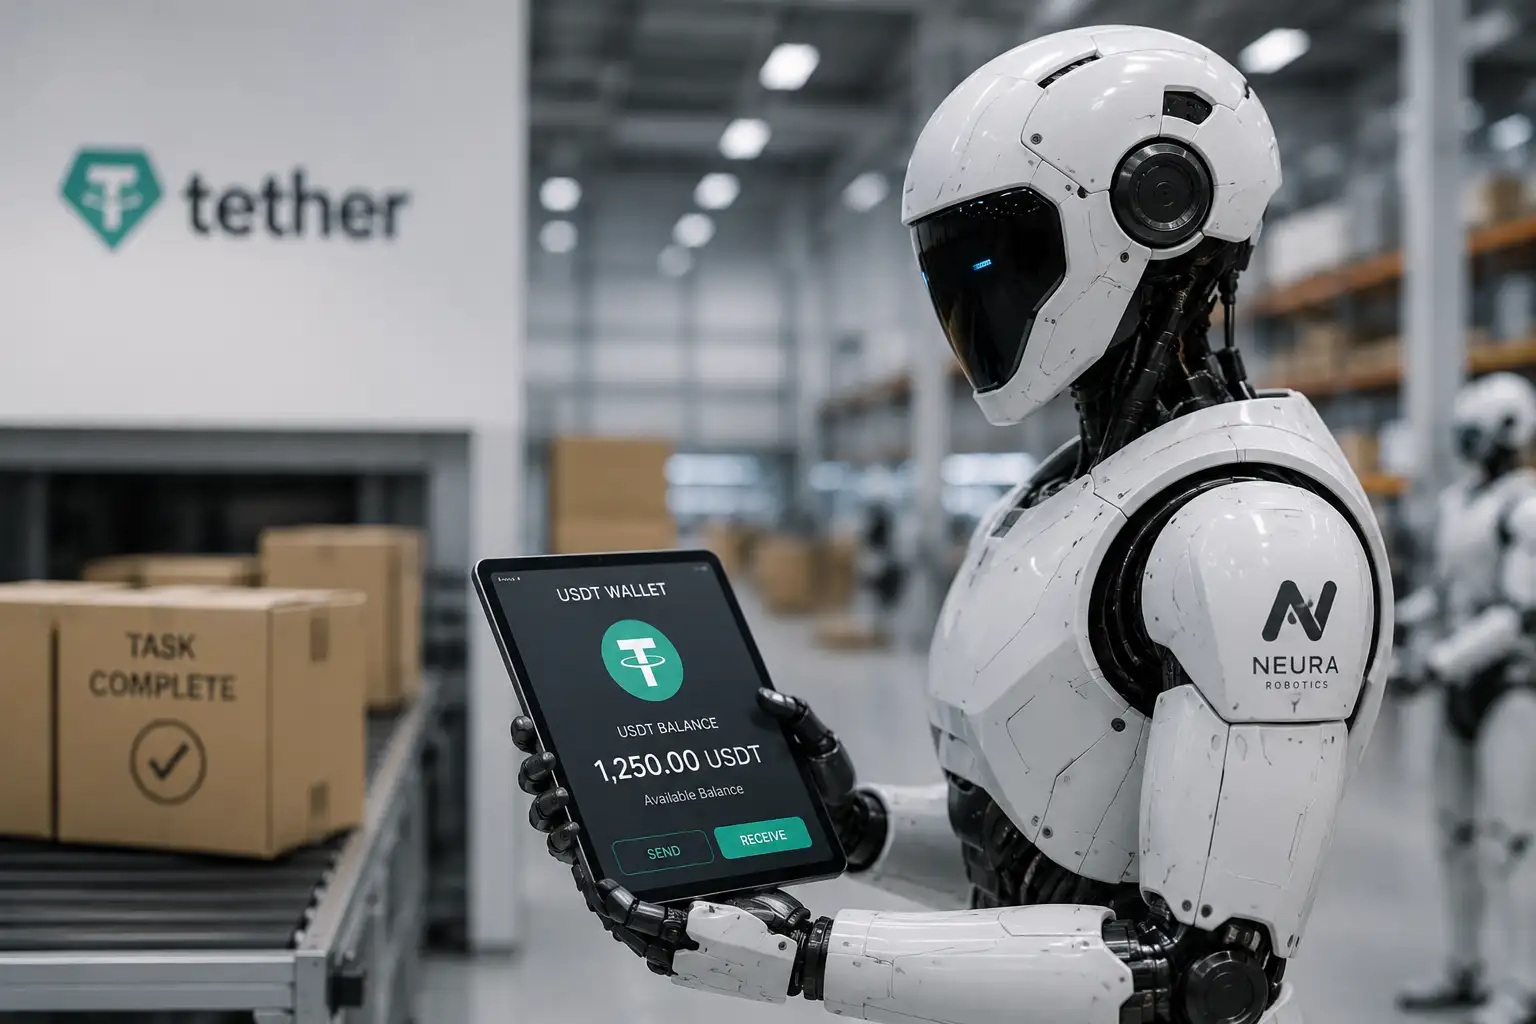
Tether is integrating USDT wallet technology into Neura Robotics' autonomous robots, allowing them to receive crypto payments for completed tasks.

AI-related mentions in SEC filings and investor presentations surged to a record 46,000 in Q1 2026, according to
On-Chain Media is an independent, reader-funded crypto media platform. Kindly consider supporting us with a donation.
bc1qp0a8vw82cs508agere759ant6xqhcfgcjpyghk
0x18d7C63AAD2679CFb0cfE1d104B7f6Ed00A3A050
CBaXXVX7bdAouqg3PciE4HjUXAhsrnFBHQ2dLcNz5hrM
Contains the last 12 releases