As the 2024 Bitcoin halving draws nearer, the crypto community stands on the cusp of another significant milestone. Apparently, the anticipated halving has continued to attract a swirl of predictions and analyses. Historically, Bitcoin halvings have led to notable market dynamics.
As we approach the #BitcoinHalving in April 2024, here are four key points to consider:
— Ali (@ali_charts) January 31, 2024
1⃣Post-halving corrections: After the 2016 and 2020 halvings, #BTC experienced corrections of 30% and 7% within a month.
2⃣Significant post-halving rallies: Following the 2012, 2016, and 2020… pic.twitter.com/aaJpJcZtAm
Historically, Bitcoin has shown a tendency for price corrections shortly after halving events. For instance, the 2016 and 2020 halvings were followed by price drops of 30% and 7%, respectively. These corrections are critical for investors to note as they shape short-term market expectations.
However, these initial dips have consistently paved the way for substantial rallies. Following the halvings in 2012, 2016, and 2020, Bitcoin surged to 11,000%, 2,850%, and 700% respectively. These figures highlight the significant growth potential of Bitcoin in the aftermath of a halving.
Moreover, the duration of bull markets post-halving has shown an increasing trend. After the first halving, the bull market lasted 365 days. This duration extended to 518 days and 549 days in the subsequent cycles. This pattern suggests a potential lengthening of bullish phases in post-halving markets.
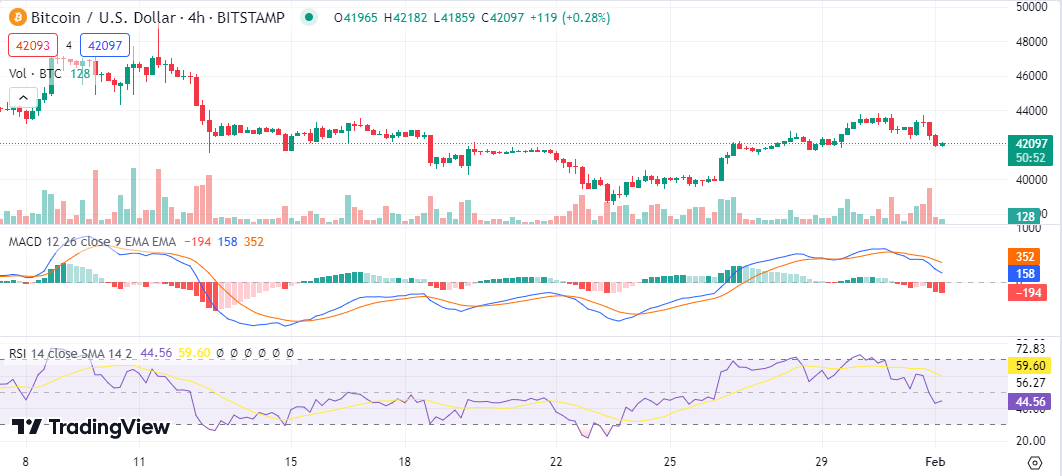
Looking ahead, BTC is trading on a bearish note as bears hold their ground tight. BTC has been consolidating around the $42k level for the past few days, as the $44k level seems a strong resistance for the bulls.
Since facing a pullback from the $43,800 mark, BTC has been trading below this level since then as the immediate support at the $42,000 level holds tight. As of this writing, BTC is exchanging hands at $42,097, down by over 1% in the past 24 hours.
BTC/USD Price Chart, Source: TradingView
Technical indicators on the hourly chart display a bearish outlook. The Relative Strength Index (RSI) indicator is trending downwards and has dropped below the 50 index, currently set at 44.68, suggesting a lack of buying pressure. The MACD indicator has shifted to the negative region and has started to print red bars, indicating a shift in the bullish trend.
Consequently, if we base our predictions on historical trends, the next Bitcoin market peak might occur around April or October 2025. This anticipation builds on the established patterns seen in previous cycles. Investors and market watchers keenly observe these trends to strategize their positions.
These historical trends provide critical insights as the Bitcoin community and investors look toward the 2024 halving.
However, it's crucial to note that while history can guide expectations, the dynamic nature of cryptocurrency markets also calls for caution. The anticipation builds not just for the halving event itself but for the market's response in its aftermath.
On-Chain Media articles are for educational purposes only. We strive to provide accurate and timely information. This information should not be construed as financial advice or an endorsement of any particular cryptocurrency, project, or service. The cryptocurrency market is highly volatile and unpredictable.Before making any investment decisions, you are strongly encouraged to conduct your own independent research and due diligence
Tags :

0 Comments
Show More

XRP faces mounting bearish pressure as whales sell millions of tokens and network activity declines.

Tether is integrating USDT wallet technology into Neura Robotics' autonomous robots, allowing them to receive crypto payments for completed tasks.

AI-related mentions in SEC filings and investor presentations surged to a record 46,000 in Q1 2026, according to
On-Chain Media is an independent, reader-funded crypto media platform. Kindly consider supporting us with a donation.
bc1qp0a8vw82cs508agere759ant6xqhcfgcjpyghk
0x18d7C63AAD2679CFb0cfE1d104B7f6Ed00A3A050
CBaXXVX7bdAouqg3PciE4HjUXAhsrnFBHQ2dLcNz5hrM
Contains the last 12 releases